Entering Interpreted Values into the Roster (formatting)
You should have the clipboard loaded with the the data you selected in column D in the Data Entry worksheet described in the previous section. Go to the Formatted worksheet (tab at the very bottom of the worksheet) to open the page shown below. Click on the top of the next empty column (in this case click on BC) to select the entire column. Then go to the Paste Special menu and select Paste Values.
Note this is NOT the Transpose function, it is different. If you make a mistake use Undo from the File menu. The entries should all be copies with some blank spots we’ll now fill in. While you are here, type in the first initial of the candidate’s name, at the green arrow.

There are three assessments used as clinical indicators (CI) that we have to format. The ultimate score is how many of tests among the IS8, HLAP and IPI tests had CI scores equal to or higher than 11 (≥11). In the case show at left, the scores were for the: IS8 (0); HLPA (3); and IPA (16), so one test (the IPI) had ≥11 indicators. Enter the number of tests with ≥11 at the blue arrow (1).

Now we need to enter four interpreted scores from the IPI report; the PDF which is the last test on your desktop. The scores need to go here, in rows 79 through 83 of the Formatted worksheet. So scroll down the worksheet to those rows and see the blank spots as outlined in blue below:
Open the IPI.pdf and scroll down the report to page 5. You’ll score this as 1, 2 or 3 from top to bottom. Higher scores predict worse performance. This candidate earned a “3” as you can see below.

So enter the score 3 at the blue arrow. OK, we have four more interpreted scores to enter. Return to the IPI and go to page 6.

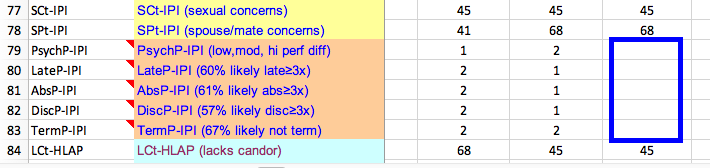
On page six you see four predictors of performance, this time we score 1 (a problem) to 2 (no problem). So the candidate below gets a score of 2 for Late<3 times, 1 for Absent≥3 times, 1 for Disciplinary Actions and a 2 for Not Terminated.

Below you see how the scores of 2 for Late<3 times, 1 for Absent≥3 times, 1 for Disciplinary Actions and 2 for Not Terminated are manually entered into the Formatting worksheet.

Now select and copy just the four scores shown above. Scroll back up the worksheet until you get to rows 13 through 16 and past the four scores there. No special paste is needed as you are coping a column to a column. See the four scores entered below in the blue box. Now you have to figure how many of the four scores were predictive of trouble; i.e., how many predictors were scored “1.” Well in this case there are two of the four tests predicting trouble for this candidate, so enter the number (2) where the red arrow is. Note, for later use, that the candidate did not have a predictive score indicating likelihood of being terminated, which is a good thing.

We have one last value to enter from the IPI.pdf. We need to scroll down to page 8 and count the number of clinical subtests that earned Scores over 70 or ≥71, not 70 but anything over 70. For this candidate, two clinical issues stood out: TP (treatment programs) and AN (anxiety).

For this candidate, two clinical issues stood out: TP (treatment programs) and AN (anxiety) as seen above. So we need to enter a 2, for T-scores exceeding 70 as shown in the green box below.

So now we have completed the Formatting worksheet in the Roster spreadsheet. It looks like the following. From this we’ll pull data to now enter into the proper Roster under the Roster 1 tab (see bottom of the above image). For final guidance go to the next section.